| # Point CLoud MNIST |
|
|
| A point cloud version of the original MNIST. |
|
|
|  |
|
|
| ## Getting Started |
|
|
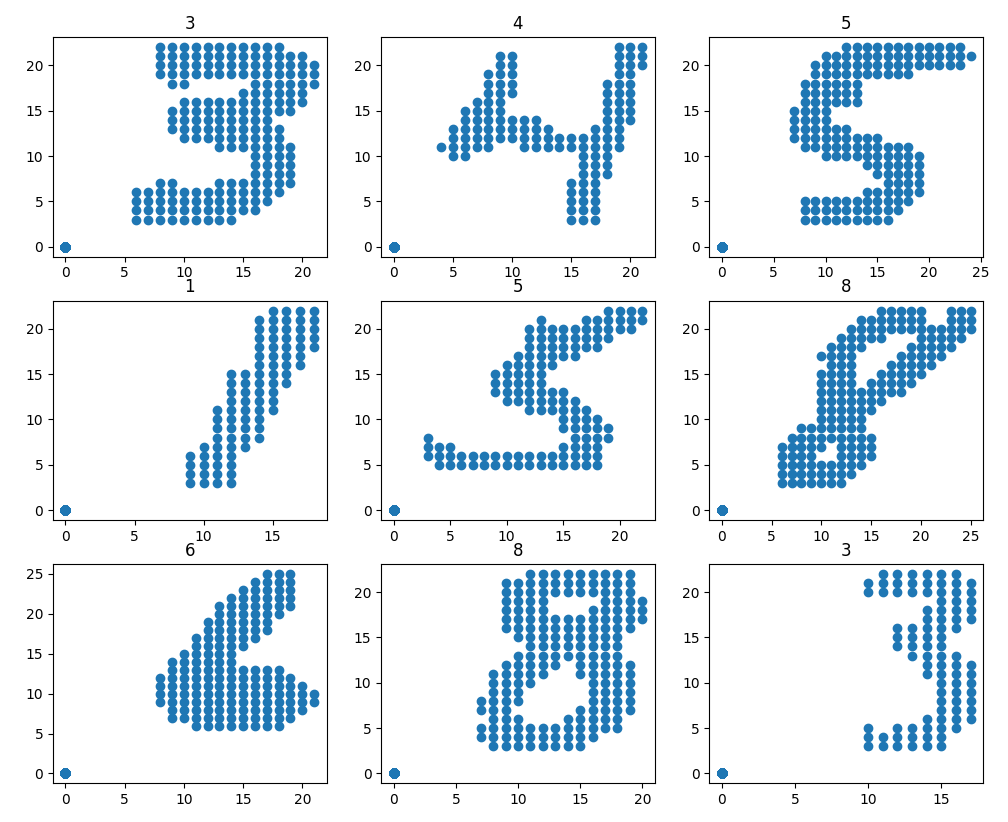
| ```python |
| import matplotlib.pyplot as plt |
| import numpy as np |
| |
| from datasets import load_dataset |
| |
| # load dataset |
| dataset = load_dataset("cgarciae/point-cloud-mnist") |
| dataset.set_format("np") |
| |
| |
| # get numpy arrays |
| X_train = dataset["train"]["points"] |
| y_train = dataset["train"]["label"] |
| X_test = dataset["test"]["points"] |
| y_test = dataset["test"]["label"] |
| |
| |
| # plot some training samples |
| figure = plt.figure(figsize=(10, 10)) |
| for i in range(3): |
| for j in range(3): |
| k = 3 * i + j |
| plt.subplot(3, 3, k + 1) |
| idx = np.random.randint(0, len(X_train)) |
| |
| plt.title(f"{y_train[idx]}") |
| plt.scatter(X_train[idx, :, 0], X_train[idx, :, 1]) |
| |
| plt.show() |
| ``` |
|
|
| ## Format |
|
|
| * `points`: `(batch, point, 3)` array of uint8. |
| * `label`: `(batch, 1)` array of uint8. |
|
|
| Where `point` is the number of points in the point cloud. Points have no order and were shuffled when creating the data. Each point has the structure `[x, y, v]` where: |
|
|
| * `x`: is the x coordinate of the point in the image. |
| * `y`: is the y coordinate of the point in the image. |
| * `v`: is the value of the pixel at the point in the image. |
|
|
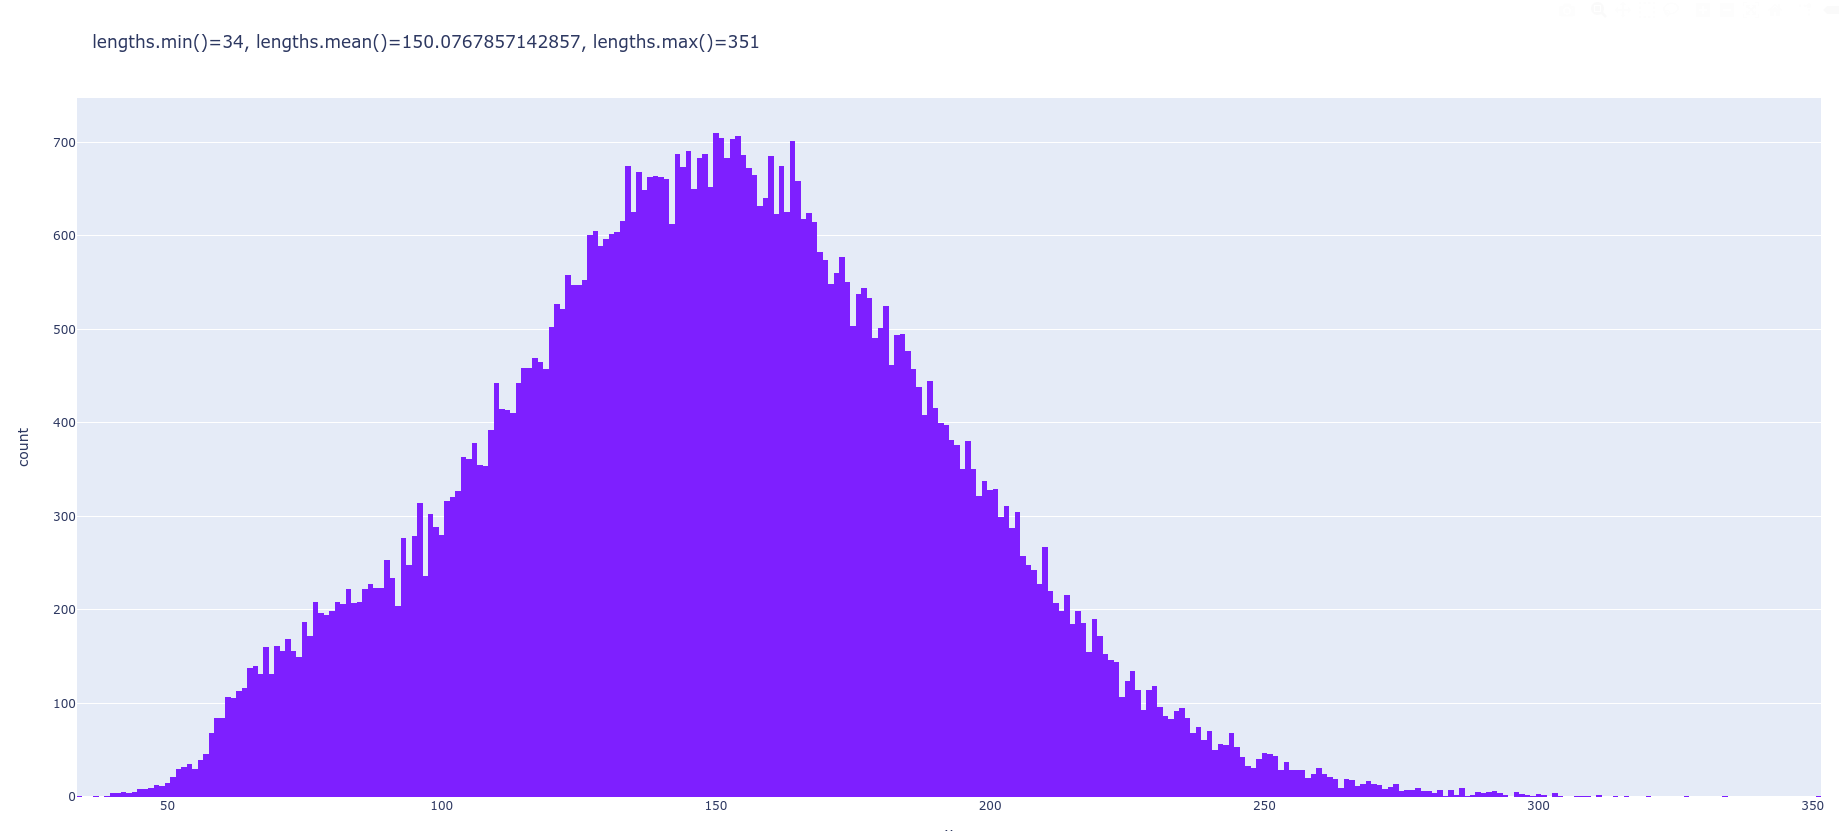
| Samples are padded with `0`s such that `point = 351` since its the largest number of non-zero pixels per image in the original dataset. You can tell apart padding point because they are the only ones where `v = 0`. |
|
|
| Here is the distribution of non-zero pixels in the MNIST: |
|
|
|  |